- (Topic 4)
You have a Power BI report that uses a dataset based on an Azure Analysis Services live connection.
You need to ensure that users can use Q&A from the Power BI service for the dataset. What should you do?
Correct Answer:
D
DRAG DROP - (Topic 4)
You have a Power BI model that contains a table named Sales. Sales has the following three measures:
✑ A measure named Total Sales Last Year that displays the sales from the previous calendar year. The current value is 32.89 million.
✑ A measure named Total Sales This Year that displays the sales from the current
calendar year. The current value is 11.69 million.
✑ A measure named Total Sales Difference that uses a DAX formula of Sales[Last Year] – Sales[This Year].
You need to create the following visualization.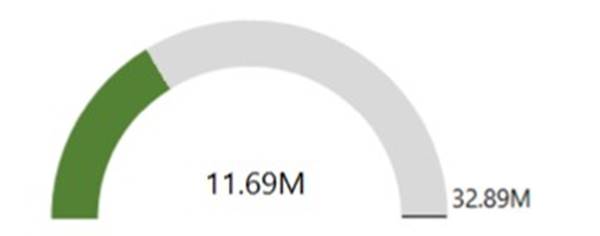
How should you configure the visualization? To answer, drag the appropriate measures to the correct fields. Each value may be used once, more than once, or not at all. You may need to drag the split bar between panes or scroll to view content.
NOTE: Each correct selection is worth one point.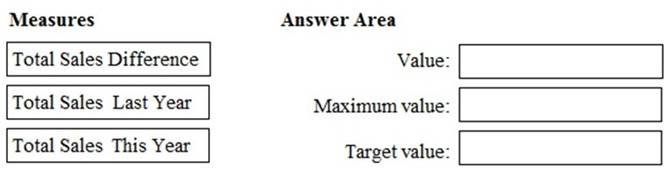
Solution:
https://docs.microsoft.com/en-us/power-bi/visuals/power-bi-visualization-radial-gauge- charts
Does this meet the goal?
Correct Answer:
A
- (Topic 4)
You have a Power BI report that contains one page. The page contains two line charts and one bar chart.
You need to ensure that users can perform the following tasks for all three visuals:
✑ Switch the measures used in the visuals.
✑ Change the visualization type.
✑ Add a legend.
The solution must minimize development effort. What should you do?
Correct Answer:
C
- (Topic 4)
You have a data model that contains many complex DAX expressions. The expressions contain frequent references to the RELATED and RELATEDTABLE functions.
You need to recommend a solution to minimize the use of the RELATED and RELATEDTABLE functions.
What should you recommend?
Correct Answer:
A
Combining data means connecting to two or more data sources, shaping them as needed, then consolidating them into a useful query.
When you have one or more columns that you’d like to add to another query, you merge the queries.
Note: The RELATEDTABLE function is a shortcut for CALCULATETABLE function with no logical expression.
CALCULATETABLE evaluates a table expression in a modified filter context and returns A
table of values.
Reference:
https://docs.microsoft.com/en-us/power-bi/connect-data/desktop-shape-and-combine-data
HOTSPOT - (Topic 4)
You have an API that returns more than 100 columns. The following is a sample of column names.
✑ client_notified_timestamp
✑ client_notified_source
✑ client_notified_sourceid
✑ client_notified_value
✑ client_responded_timestamp
✑ client_responded_source
✑ client_responded_sourceid
✑ client_responded_value
You plan to include only a subset of the returned columns.
You need to remove any columns that have a suffix of sourceid.
How should you complete the Power Query M code? To answer, select the appropriate options in the answer area.
NOTE: Each correct selection is worth one point.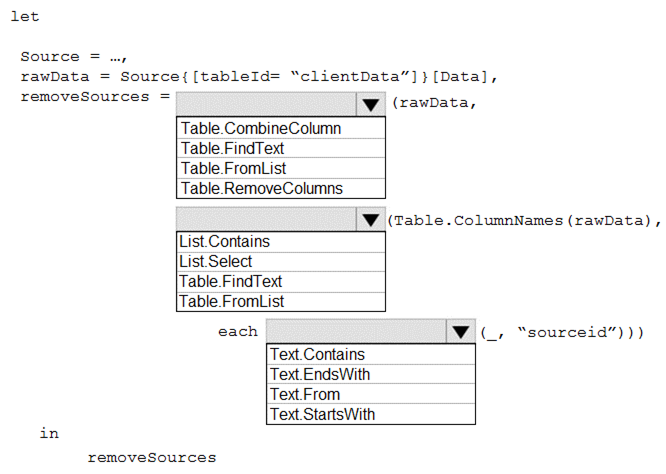
Solution:
Box 1: Table.RemoveColumns
When you do “Remove Columns” Power Query uses the Table.RemoveColumns function
Box 2: List.Select Get a list of columns.
Box 3: Text.EndsWith
Does this meet the goal?
Correct Answer:
A
