- (Topic 4)
You need to create the On-Time Shipping report.
The report must include a visualization that shows the percentage of late orders. Which type of visualization should you create?
Correct Answer:
B
- (Topic 4)
Your organization has a team of power users who recently created 20 Power BI dashboards.
The power users share the dashboards with other users in the organization.
When the users attempt to access the dashboards, they receive the error message shown in the exhibit. (Click the Exhibit.)
You need to ensure that all the users can access the dashboards. What should you do first?
Correct Answer:
A
References: http://www.nubo.eu/en/blog/2016/12/Enable-PowerBI-On-Office-365/
HOTSPOT - (Topic 4)
You have a dataset named Pens that contains the following columns:
✑ Item
✑ Unit Price
✑ Quantity Ordered
You need to create a visualization that shows the relationship between Unit Price and Quantity Ordered. The solution must highlight orders that have a similar unit price and ordered quantity.
Which type of visualization and which feature should you use? To answer, select the appropriate options in the answer area.
NOTE: Each correct selection is worth one point.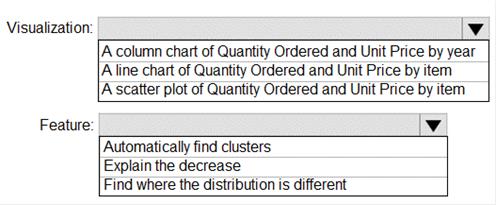
Solution:
Box 1: A scatter plot...
A scatter chart always has two value axes to show: one set of numerical data along a horizontal axis and another set of numerical values along a vertical axis. The chart displays points at the intersection of an x and y numerical value, combining these values into single data points. Power BI may distribute these data points evenly or unevenly across the horizontal axis. It depends on the data the chart represents.
Box 2: Automatically find clusters
Scatter charts are a great choice to show patterns in large sets of data, for example by showing linear or non-linear trends, clusters, and outliers.
Does this meet the goal?
Correct Answer:
A
HOTSPOT - (Topic 4)
You have two CSV files named Products and Categories. The Products file contains the following columns:
✑ ProductID
✑ ProductName
✑ SupplierID
✑ CategoryID
The Categories file contains the following columns:
✑ CategoryID
✑ CategoryName
✑ CategoryDescription
From Power BI Desktop, you import the files into Power Query Editor.
You need to create a Power BI dataset that will contain a single table named Product. The Product will table includes the following columns:
✑ ProductID
✑ ProductName
✑ SupplierID
✑ CategoryID
✑ CategoryName
✑ CategoryDescription
How should you combine the queries, and what should you do on the Categories query? To answer, select the appropriate options in the answer area.
NOTE: Each correct selection is worth one point.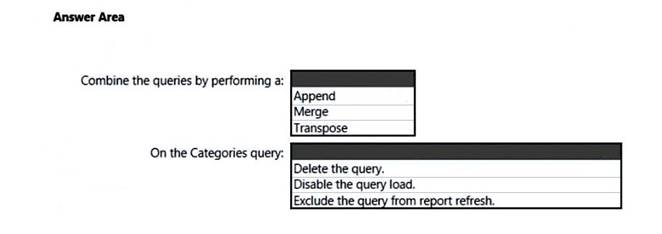
Solution: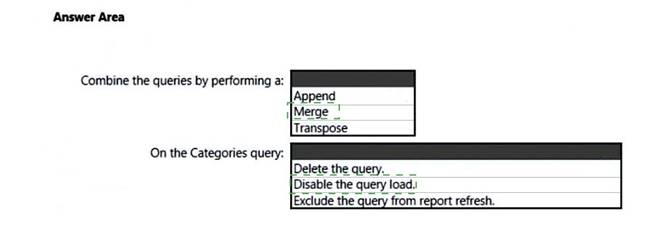
Does this meet the goal?
Correct Answer:
A
- (Topic 4)
You have a Power B1 report that contains three pages named Page1, Page2, and Page3. All the pages have the same slicers. You need to ensure that all the filters applied to Page1 apply to Page1 and Page3 only. What should you do?
Correct Answer:
A
