HOTSPOT - (Topic 4)
You plan to create a Power Bl dataset to analyze attendance at a school. Data will come from two separate views named View1 and View? in an Azure SQL database. View1 contains the columns shown in the following table.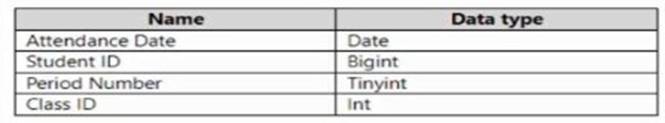
View2 contains the columns shown in the following table.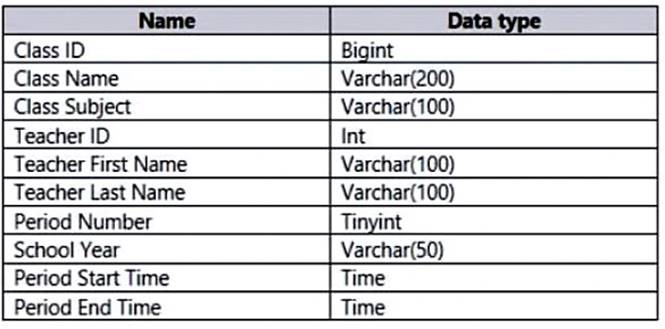
The views can be related based on the Class ID column.
Class ID is the unique identifier for the specified class, period, teacher, and school year. For example, the same class can be taught by the same teacher during two different periods, but the class will have a different class ID.
You need to design a star schema data model by using the data in both views. The solution must facilitate the following analysis:
✑ The count of classes that occur by period
✑ The count of students in attendance by period by day
✑ The average number of students attending a class each month
In which table should you include the Teacher First Name and Period Number fields? To answer, select the appropriate options in the answer area.
NOTE: Each correct selection is worth one point.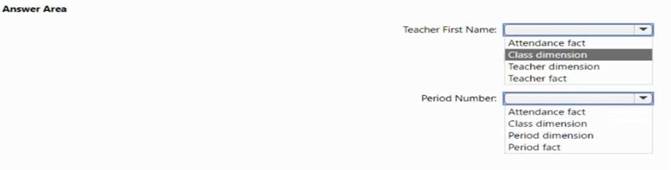
Solution:
Teacher dimension Class dimension
Does this meet the goal?
Correct Answer:
A
- (Topic 4)
You have a BI dataset and a connected report.
You need to ensure that users can analyze data in Microsoft Excel by connecting directly to the dataset.
You grant the users the Build permission for dataset What Should do next?
Correct Answer:
B
HOTSPOT - (Topic 4)
You need to create a visual as shown in the following exhibit.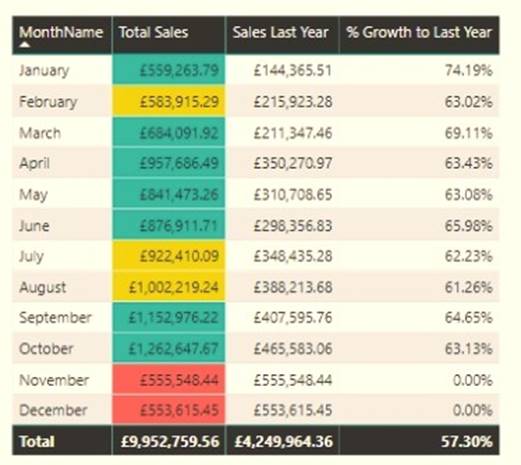
The indicator color for Total Sales will be based on % Growth to Last Year. The solution must use the existing calculations only.
How should you configure the visual? To answer, select the appropriate options in the answer area.
NOTE: Each correct selection is worth one point.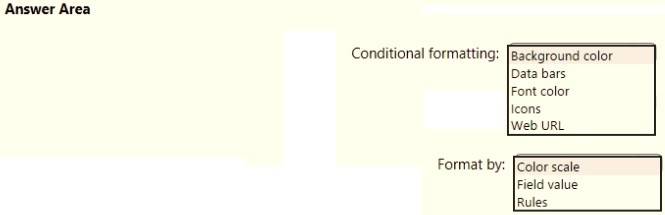
Solution:
Box 1: Background color
To format the Color column based on its field values, select Conditional formatting for the Color field, and then select Background color or Font color.
In the Background color or Font color dialog box, select Field value from the Format by drop-down field.
Box 2: Field value
With conditional formatting for tables in Power BI Desktop, you can specify customized cell colors, including color gradients, based on field values.
Does this meet the goal?
Correct Answer:
A
- (Topic 4)
Note: This question is part of a series of questions that present the same scenario. Each question in the series contains a unique solution that might meet the stated goals. Some question sets might have more than one correct solution, while others might not have a correct solution.
After you answer a question in this section, you will NOT be able to return to it. As a result, these questions will not appear in the review screen.
From Power Query Editor, you profile the data shown in the following exhibit.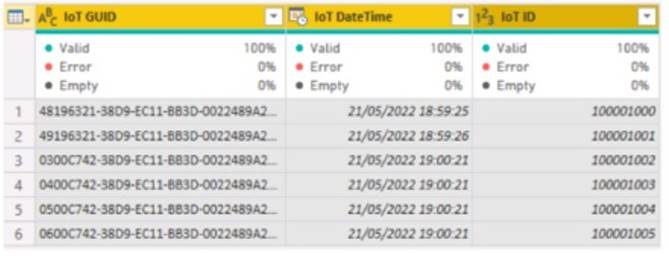
The IoT GUID and IoT ID columns are unique to each row in query.
You need to analyze IoT events by the hour and day of the year. The solution must improve dataset performance.
Solution: You split the loT DateTime column into a column named Date and a column named Time.
Does this meet the goal?
Correct Answer:
B
- (Topic 4)
You have a Power Bl report that contains a page. The page contains the following:
• A shape named Shape 1
• A card named Sales Summary
• A clustered bar chart named Sales by Region
You need to ensure that Sales Summary renders on top of Shape 1. What should you modify?
Correct Answer:
B
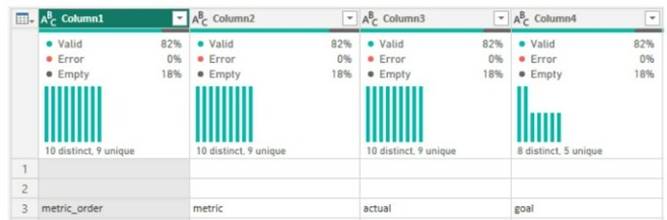
You use Power Query Editor to preview the data shown in the following exhibit.
You confirm that the data will always start on row 3, and row 3 will always contain the column names.
You use Power Query Editor to preview the data shown in the following exhibit.