The data engineering team maintains a table of aggregate statistics through batch nightly updates. This includes total sales for the previous day alongside totals and averages for a variety of time periods including the 7 previous days, year-to-date, and quarter-to-date. This table is named store_saies_summary and the schema is as follows:
The table daily_store_sales contains all the information needed to update store_sales_summary. The schema for this table is: store_id INT, sales_date DATE, total_sales FLOAT If daily_store_sales is implemented as a Type 1 table and the total_sales column might be adjusted after manual data auditing, which approach is the safest to generate accurate reports in the store_sales_summary table?
Correct Answer:
E
The daily_store_sales table contains all the information needed to update store_sales_summary. The schema of the table is:
store_id INT, sales_date DATE, total_sales FLOAT
The daily_store_sales table is implemented as a Type 1 table, which means that old values are overwritten by new values and no history is maintained. The total_sales column might be adjusted after manual data auditing, which means that the data in the table may change over time.
The safest approach to generate accurate reports in the store_sales_summary table is to use Structured Streaming to subscribe to the change data feed for daily_store_sales and apply changes to the aggregates in the store_sales_summary table with each update. Structured Streaming is a scalable and fault-tolerant stream processing engine built on Spark SQL. Structured Streaming allows processing data streams as if they were tables or DataFrames, using familiar operations such as select, filter, groupBy, or join. Structured Streaming also supports output modes that specify how to write the results of a streaming query to a sink, such as append, update, or complete. Structured Streaming can handle both streaming and batch data sources in a unified manner.
The change data feed is a feature of Delta Lake that provides structured streaming sources that can subscribe to changes made to a Delta Lake table. The change data feed captures both data changes and schema changes as ordered events that can be processed by downstream applications or services. The change data feed can be configured with different options, such as starting from a specific version or timestamp, filtering by operation type or partition values, or excluding no-op changes.
By using Structured Streaming to subscribe to the change data feed for daily_store_sales, one can capture and process any changes made to the total_sales column due to manual data auditing. By applying these changes to the aggregates in the store_sales_summary table with each update, one can ensure that the reports are always consistent and accurate with the latest data. Verified References: [Databricks Certified Data Engineer Professional], under “Spark Core” section; Databricks Documentation, under “Structured Streaming” section; Databricks Documentation, under “Delta Change Data Feed” section.
When evaluating the Ganglia Metrics for a given cluster with 3 executor nodes, which indicator would signal proper utilization of the VM's resources?
Correct Answer:
E
In the context of cluster performance and resource utilization, a CPU utilization rate of around 75% is generally considered a good indicator of efficient resource usage. This level of CPU utilization suggests that the cluster is being effectively used without being overburdened or underutilized.
✑ A consistent 75% CPU utilization indicates that the cluster's processing power is being effectively employed while leaving some headroom to handle spikes in workload or additional tasks without maxing out the CPU, which could lead to performance degradation.
✑ A five Minute Load Average that remains consistent/flat (Option A) might indicate underutilization or a bottleneck elsewhere.
✑ Monitoring network I/O (Options B and C) is important, but these metrics alone don't provide a complete picture of resource utilization efficiency.
✑ Total Disk Space (Option D) remaining constant is not necessarily an indicator of proper resource utilization, as it's more related to storage rather than computational efficiency.
References:
✑ Ganglia Monitoring System: Ganglia Documentation
✑ Databricks Documentation on Monitoring: Databricks Cluster Monitoring
The data science team has created and logged a production model using MLflow. The following code correctly imports and applies the production model to output the predictions as a new DataFrame named preds with the schema "customer_id LONG, predictions DOUBLE, date DATE".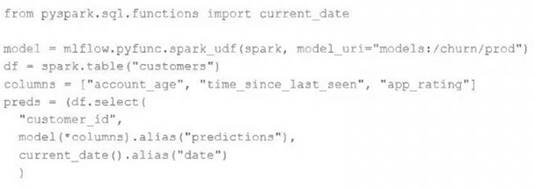
The data science team would like predictions saved to a Delta Lake table with the ability to compare all predictions across time. Churn predictions will be made at most once per day.
Which code block accomplishes this task while minimizing potential compute costs?
A) preds.write.mode("append").saveAsTable("churn_preds")
B) preds.write.format("delta").save("/preds/churn_preds")
C) 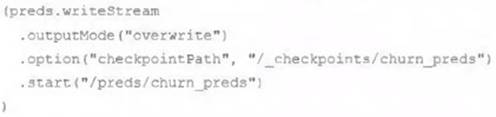
D)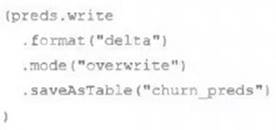
E)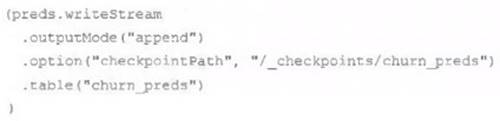
Correct Answer:
A
Each configuration below is identical to the extent that each cluster has 400 GB total of RAM, 160 total cores and only one Executor per VM.
Given a job with at least one wide transformation, which of the following cluster configurations will result in maximum performance?
Correct Answer:
B
This is the correct answer because it is the cluster configuration that will result in maximum performance for a job with at least one wide transformation. A wide transformation is a type of transformation that requires shuffling data across partitions, such as join, groupBy, or orderBy. Shuffling can be expensive and time-consuming, especially if there are too many or too few partitions. Therefore, it is important to choose a cluster configuration that can balance the trade-off between parallelism and network overhead. In this case, having 8 VMs with 50 GB per executor and 20 cores per executor will create 8 partitions, each with enough memory and CPU resources to handle the shuffling efficiently. Having fewer VMs with more memory and cores per executor will create fewer partitions, which will reduce parallelism and increase the size of each shuffle block. Having more VMs with less memory and cores per executor will create more partitions, which will increase parallelism but also increase the network overhead and the number of shuffle files. Verified References: [Databricks Certified Data Engineer Professional], under “Performance Tuning” section; Databricks Documentation, under “Cluster configurations” section.
A Structured Streaming job deployed to production has been experiencing delays during peak hours of the day. At present, during normal execution, each microbatch of data is processed in less than 3 seconds. During peak hours of the day, execution time for each microbatch becomes very inconsistent, sometimes exceeding 30 seconds. The streaming write is currently configured with a trigger interval of 10 seconds.
Holding all other variables constant and assuming records need to be processed in less than 10 seconds, which adjustment will meet the requirement?
Correct Answer:
E
The adjustment that will meet the requirement of processing records in less than 10 seconds is to decrease the trigger interval to 5 seconds. This is because triggering batches more frequently may prevent records from backing up and large batches from causing spill. Spill is a phenomenon where the data in memory exceeds the available capacity and has to be written to disk, which can slow down the processing and increase the execution time1. By reducing the trigger interval, the streaming query can process smaller batches of data more quickly and avoid spill. This can also improve the latency and throughput of the streaming job2.
The other options are not correct, because:
✑ Option A is incorrect because triggering batches more frequently does not allow idle executors to begin processing the next batch while longer running tasks from previous batches finish. In fact, the opposite is true. Triggering batches more frequently may cause concurrent batches to compete for the same resources and cause contention and backpressure2. This can degrade the performance and stability of the streaming job.
✑ Option B is incorrect because increasing the trigger interval to 30 seconds is not a good practice to ensure no records are dropped. Increasing the trigger interval means that the streaming query will process larger batches of data less frequently, which can increase the risk of spill, memory pressure, and timeouts12. This can also increase the latency and reduce the throughput of the streaming job.
✑ Option C is incorrect because the trigger interval can be modified without modifying the checkpoint directory. The checkpoint directory stores the metadata and state of the streaming query, such as the offsets, schema, and configuration3. Changing the trigger interval does not affect the state of the streaming query, and does not require a new checkpoint directory. However, changing the number of shuffle partitions may affect the state of the streaming query, and may require a new checkpoint directory4.
✑ Option D is incorrect because using the trigger once option and configuring a Databricks job to execute the query every 10 seconds does not ensure that all backlogged records are processed with each batch. The trigger once option means that the streaming query will process all the available data in the source and then stop5. However, this does not guarantee that the query will finish processing within 10 seconds, especially if there are a lot of records in the source. Moreover, configuring a Databricks job to execute the query every 10 seconds may cause overlapping or missed batches, depending on the execution time of the query.
References: Memory Management Overview, Structured Streaming Performance Tuning Guide, Checkpointing, Recovery Semantics after Changes in a Streaming Query, Triggers
