- (Exam Topic 2)
You need to configure the Feature Based Feature Selection module based on the experiment requirements and datasets.
How should you configure the module properties? To answer, select the appropriate options in the dialog box in the answer area.
NOTE: Each correct selection is worth one point.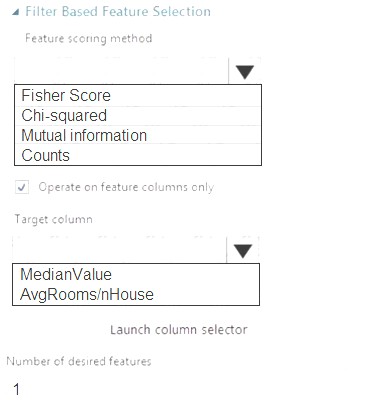
Solution:
Box 1: Mutual Information.
The mutual information score is particularly useful in feature selection because it maximizes the mutual information between the joint distribution and target variables in datasets with many dimensions.
Box 2: MedianValue
MedianValue is the feature column, , it is the predictor of the dataset.
Scenario: The MedianValue and AvgRoomsinHouse columns both hold data in numeric format. You need to select a feature selection algorithm to analyze the relationship between the two columns in more detail.
References:
https://docs.microsoft.com/en-us/azure/machine-learning/studio-module-reference/filter-based-feature-selection
Does this meet the goal?
Correct Answer:
A
- (Exam Topic 3)
You create a binary classification model by using Azure Machine Learning Studio.
You must tune hyperparameters by performing a parameter sweep of the model. The parameter sweep must meet the following requirements: iterate all possible combinations of hyperparameters
 minimize computing resources required to perform the sweep You need to perform a parameter sweep of the model.
Which parameter sweep mode should you use?
Correct Answer:
D
Maximum number of runs on random grid: This option also controls the number of iterations over a random sampling of parameter values, but the values are not generated randomly from the specified range; instead, a matrix is created of all possible combinations of parameter values and a random sampling is taken over the matrix. This method is more efficient and less prone to regional oversampling or undersampling.
If you are training a model that supports an integrated parameter sweep, you can also set a range of seed values to use and iterate over the random seeds as well. This is optional, but can be useful for avoiding bias introduced by seed selection.
- (Exam Topic 3)
You train a machine learning model.
You must deploy the model as a real-time inference service for testing. The service requires low CPU utilization and less than 48 MB of RAM. The compute target for the deployed service must initialize automatically while minimizing cost and administrative overhead.
Which compute target should you use?
Correct Answer:
C
Azure Container Instances (ACI) are suitable only for small models less than 1 GB in size. Use it for low-scale CPU-based workloads that require less than 48 GB of RAM.
Note: Microsoft recommends using single-node Azure Kubernetes Service (AKS) clusters for dev-test of larger models.
Reference:
https://docs.microsoft.com/id-id/azure/machine-learning/how-to-deploy-and-where
- (Exam Topic 3)
Note: This question is part of a series of questions that present the same scenario. Each question in the series contains a unique solution that might meet the stated goals. Some question sets might have more than one correct solution, while others might not have a correct solution.
After you answer a question in this section, you will NOT be able to return to it. As a result, these questions will not appear in the review screen.
You plan to use a Python script to run an Azure Machine Learning experiment. The script creates a reference to the experiment run context, loads data from a file, identifies the set of unique values for the label column, and completes the experiment run:
from azureml.core import Run import pandas as pd
run = Run.get_context()
data = pd.read_csv('data.csv') label_vals = data['label'].unique()
# Add code to record metrics here run.complete()
The experiment must record the unique labels in the data as metrics for the run that can be reviewed later.
You must add code to the script to record the unique label values as run metrics at the point indicated by the comment.
Solution: Replace the comment with the following code: for label_val in label_vals:
run.log('Label Values', label_val) Does the solution meet the goal?
Correct Answer:
A
The run_log function is used to log the contents in label_vals: for label_val in label_vals:
run.log('Label Values', label_val) Reference:
https://www.element61.be/en/resource/azure-machine-learning-services-complete-toolbox-ai
- (Exam Topic 3)
You plan to use a Deep Learning Virtual Machine (DLVM) to train deep learning models using Compute Unified Device Architecture (CUDA) computations.
You need to configure the DLVM to support CUDA. What should you implement?
Correct Answer:
C
A Deep Learning Virtual Machine is a pre-configured environment for deep learning using GPU instances.
References:
https://azuremarketplace.microsoft.com/en-au/marketplace/apps/microsoft-ads.dsvm-deep-learning
